WHY CHOOSE BI
-
From Raw Data to Smart Actions
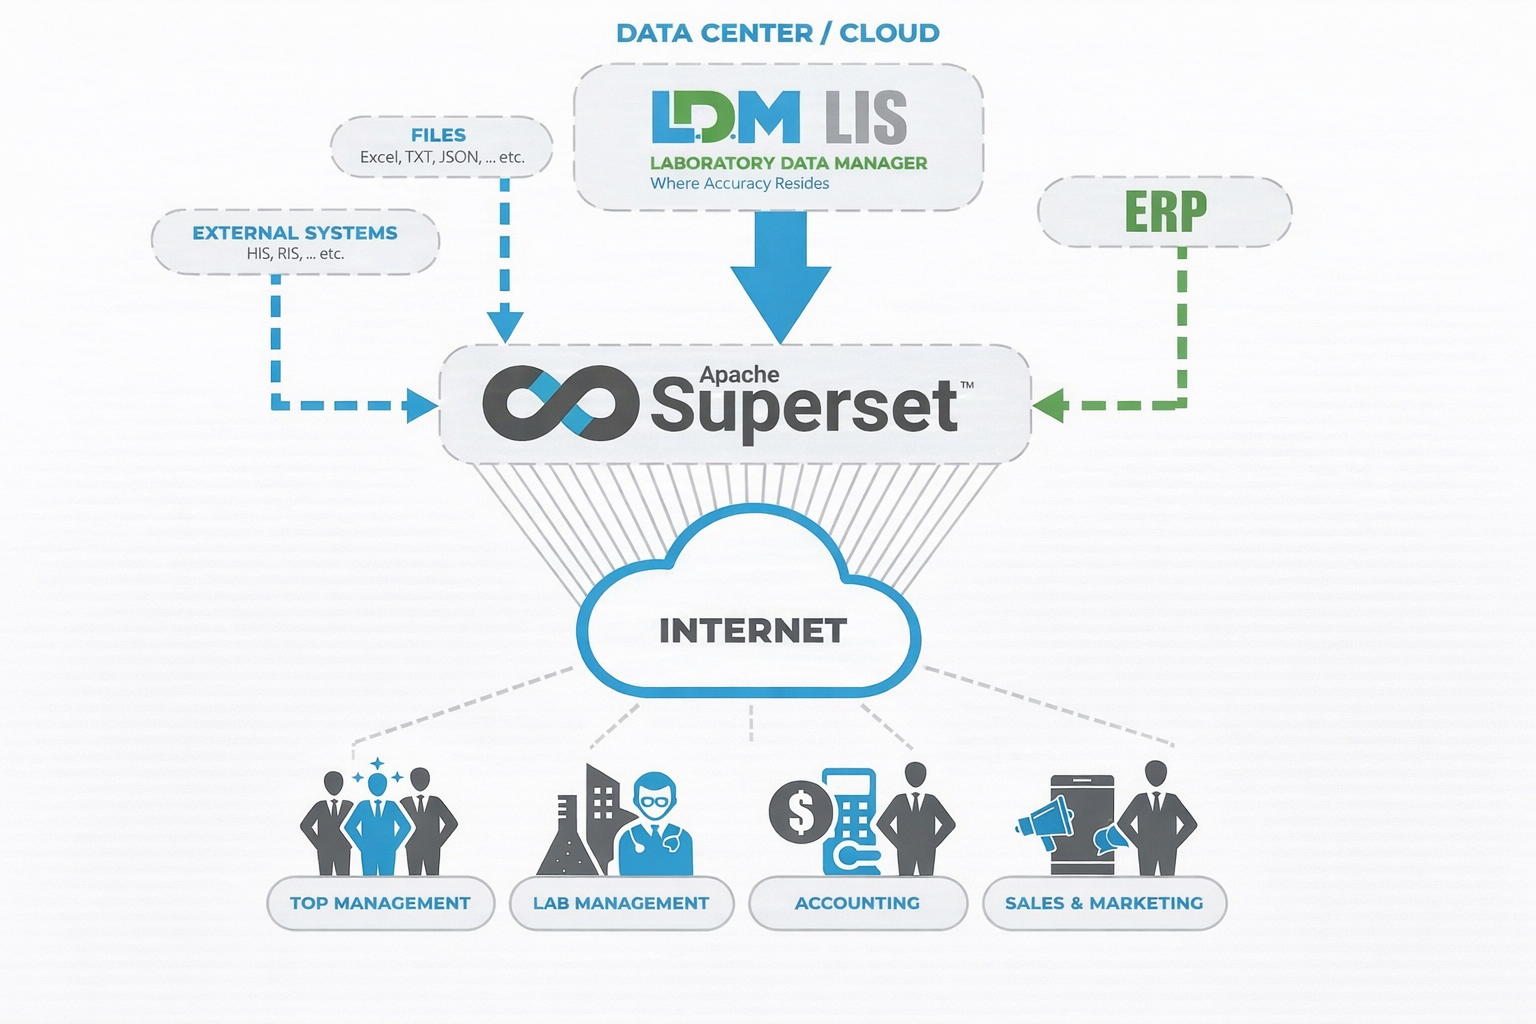
Superset is a powerful open-source BI platform. Paired with our expertise in lab systems, it enables your lab to:
Unify Your Data:Merge LIS, ERP, and HIS and other data sources like CSV files into one intelligent dashboards platform.
Access Near Real-Time Insights:
Go beyond statistical reports with interactive dashboards.
Enable Data-Driven Decisions:Help staff and management act on key performance trends.
Avoid Costly Licenses:Enjoy the flexibility of a customizable, scalable open-source solution.
-
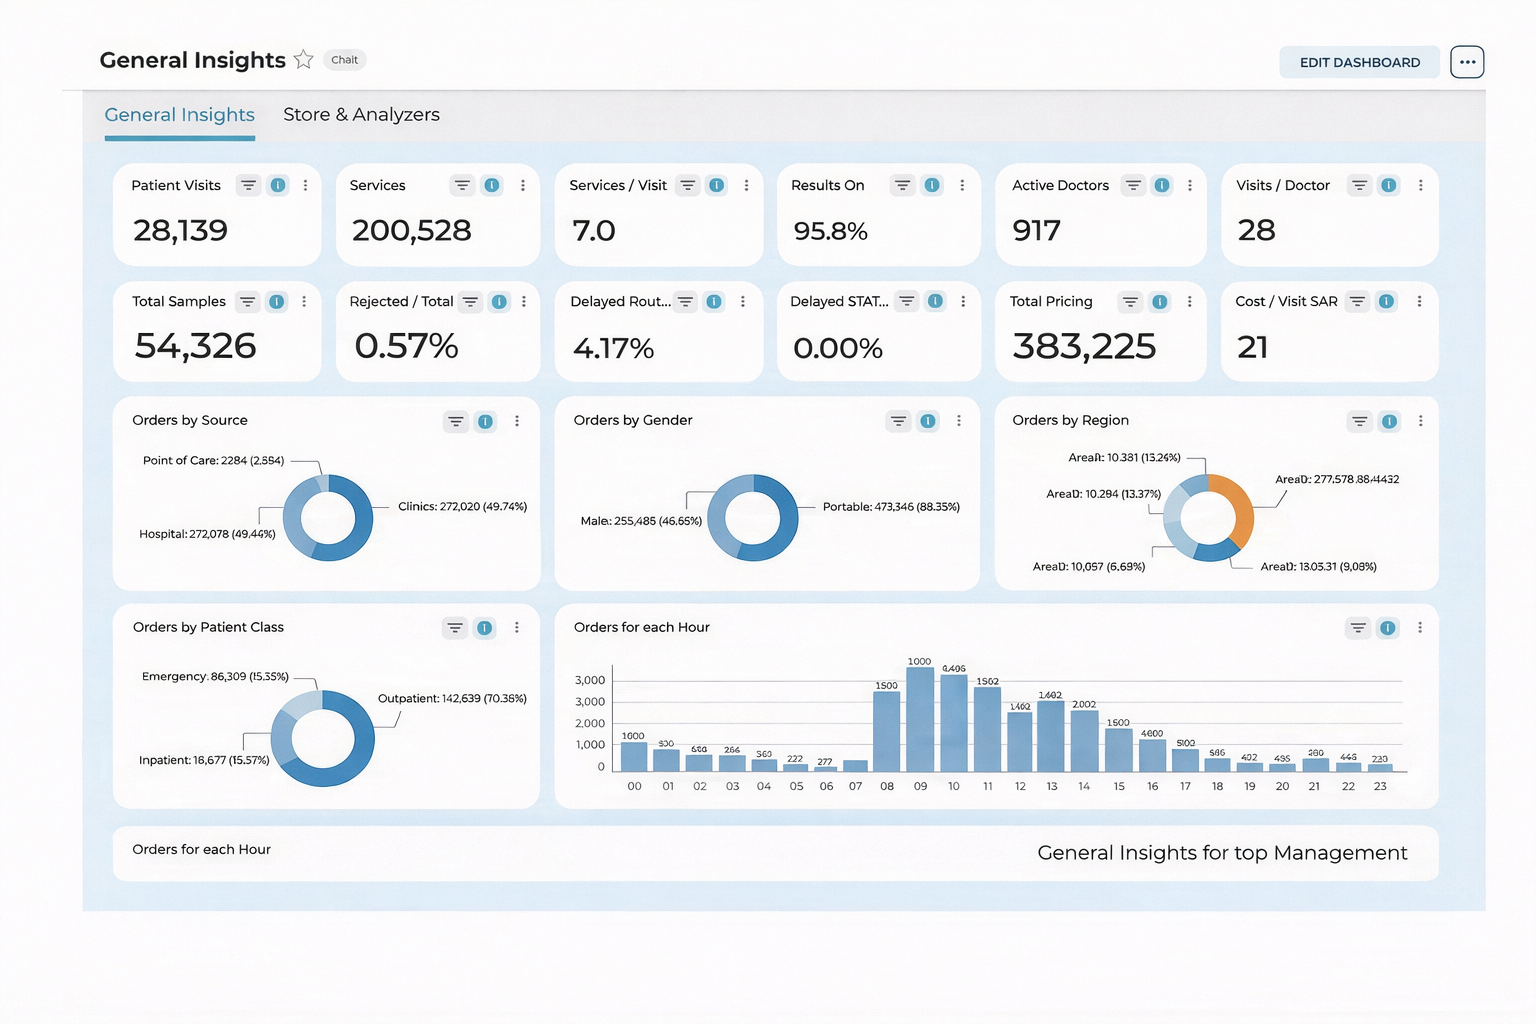
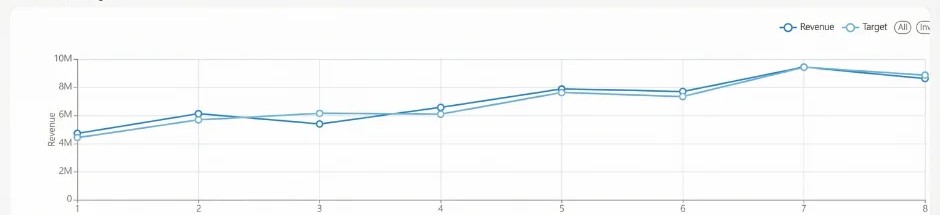
Executive Summary DashboardPerformance Snapshot:
Tests, revenue, delays, quality.
Automated Reports:Scheduled delivery to managers via email (daily/weekly/monthly).
-
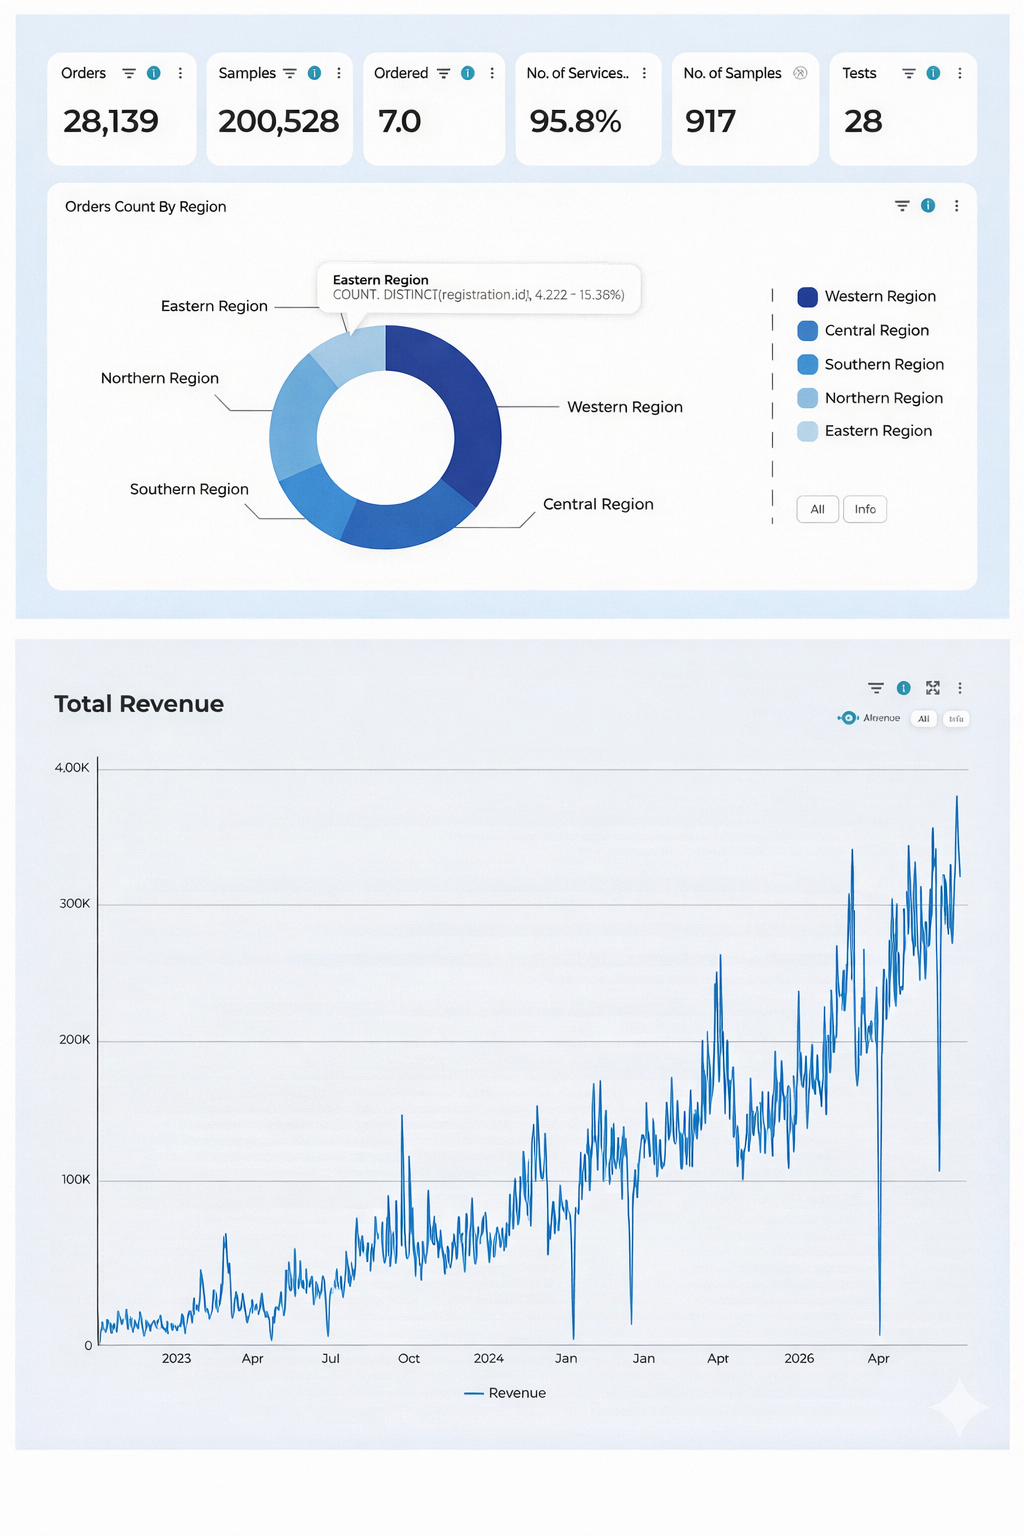
Financial & Operational MetricsRevenue & Profitability:
Analyze revenue by test, region, patient type, and referral.
Client Insights:
Track loyalty and churn among B2B labs, insurers, and physicians.
Inventory Control:Monitor stock value, expiry, usage, and supplier performance.

-
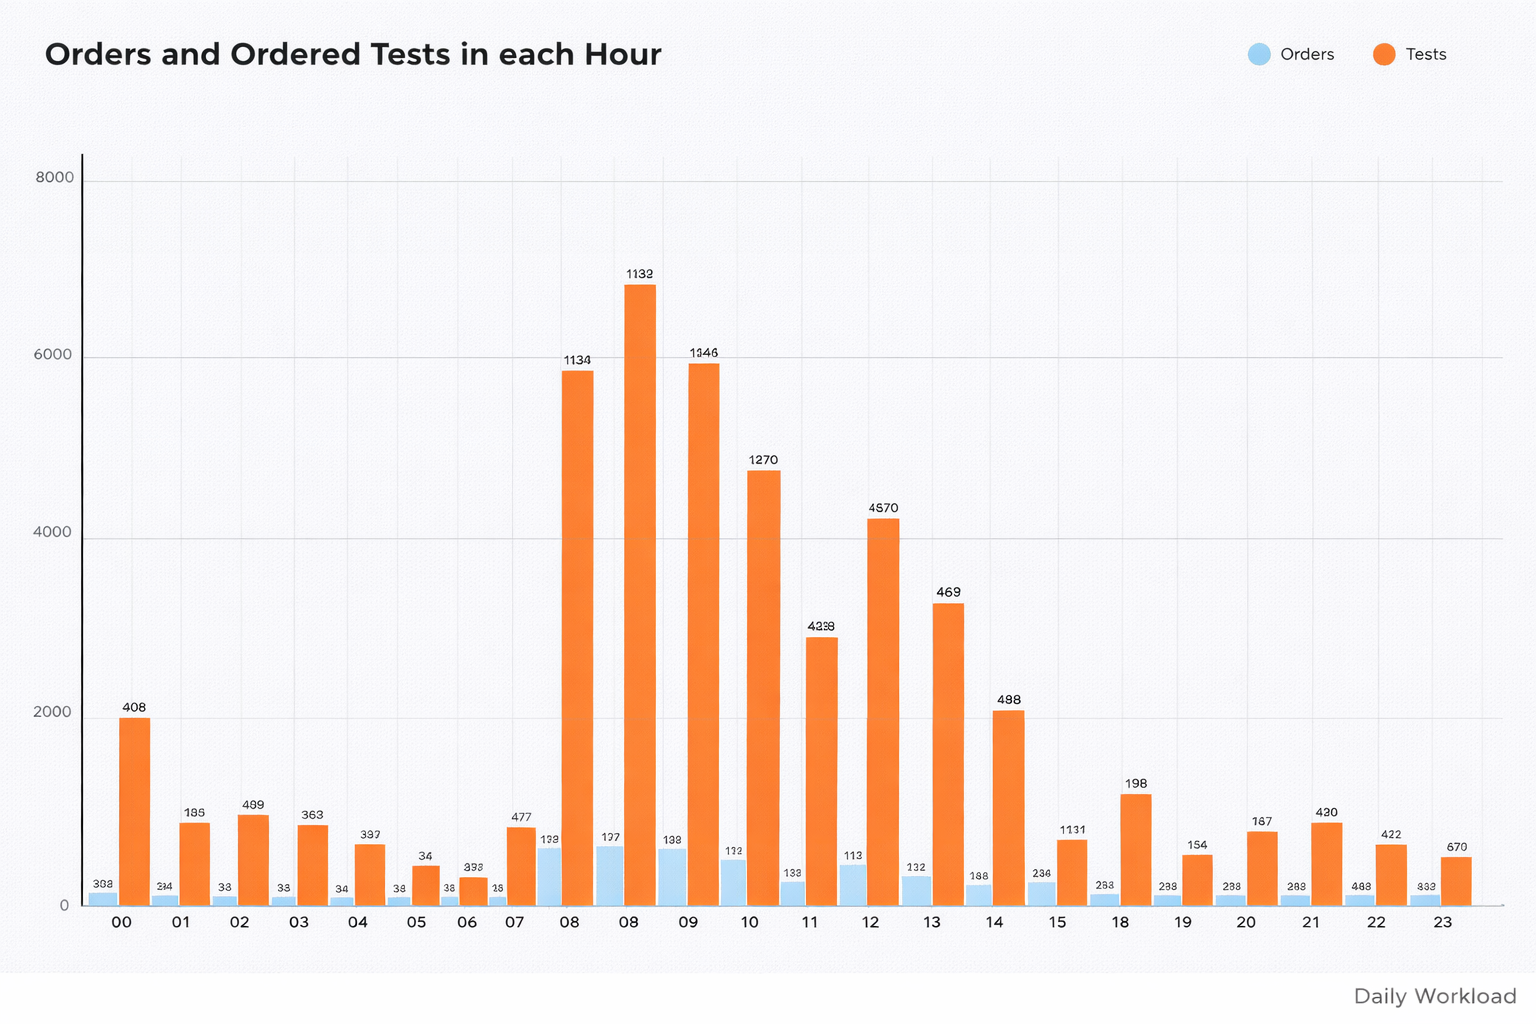
Efficiency & WorkloadLab Throughput:
See daily test volumes and workload.
Turnaround Time (TAT):Measure delays by test, section, and technician.
Instrument Utilization:Monitor usage, reruns, and downtime.
Staff Productivity:Review metrics per employee to optimize assignments.
Sample Flow:Track hourly sample receipt to improve staffing.
Order Accuracy:Identify entry errors and reduce registration mistakes.
-
Quality & ComplianceQC Monitoring:
View pass/fail rates, deviations, and retests.
Incidents:Track resolution times for QC issues.
-
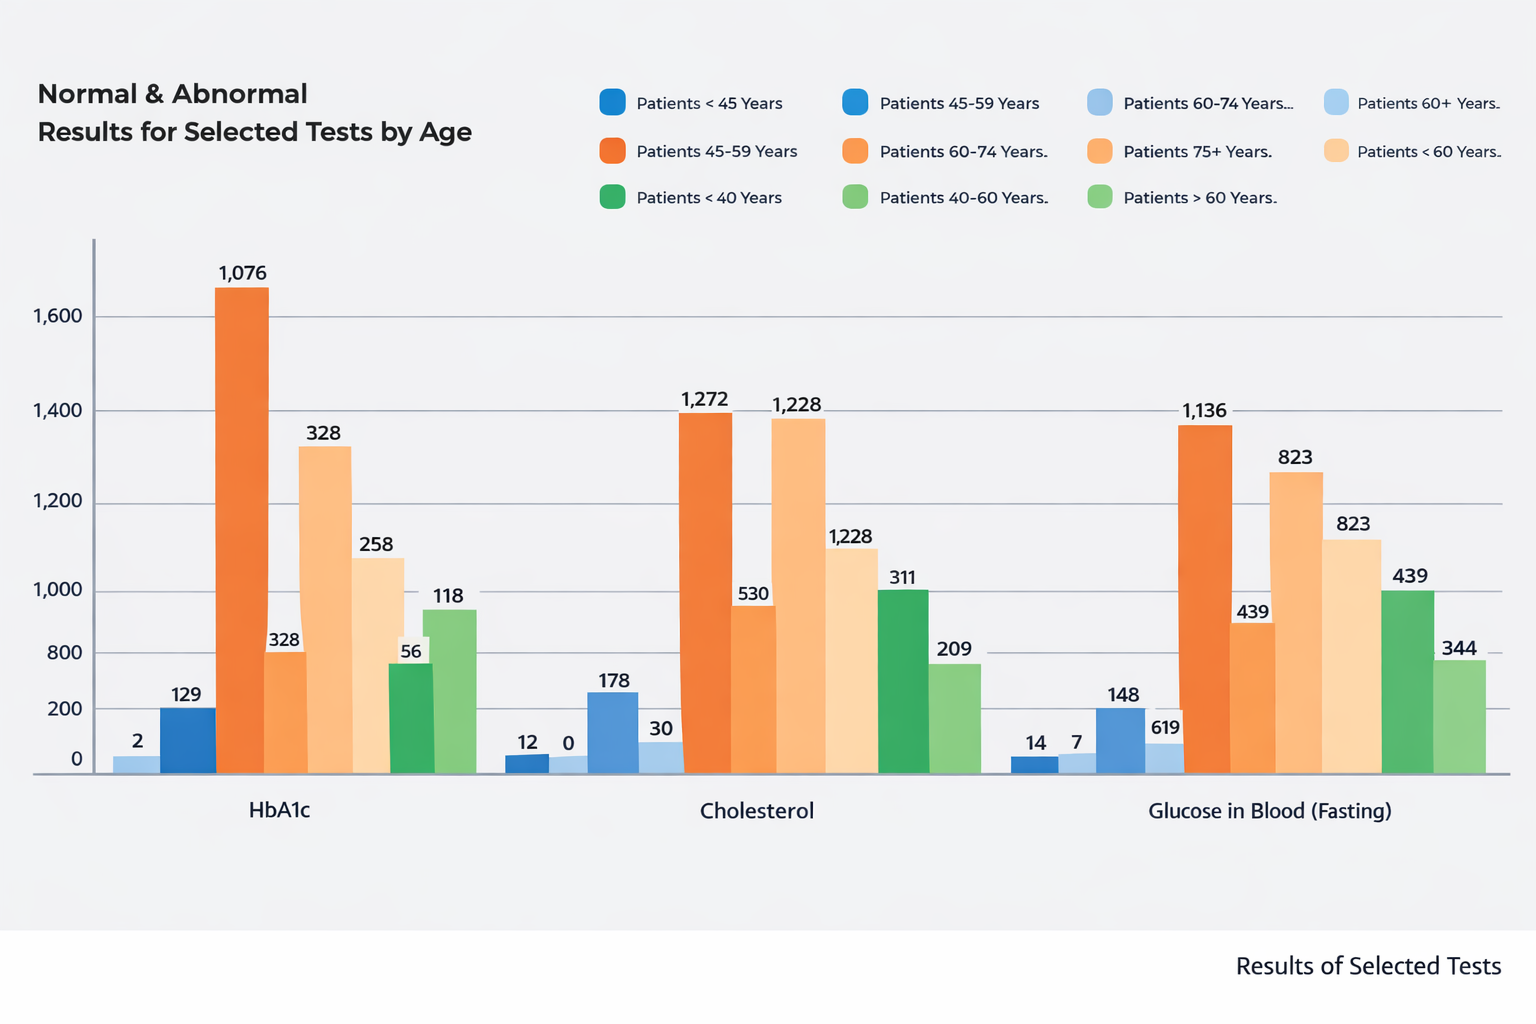
Public Health InsightsMonitor Selected Tests Results:
Monitor rates of key markers (HbA1c, cholesterol, etc.) by age, location, and gender.
National Surveillance Dashboard:• Disease trends and alerts for notifiable diseases.
National AMR & Microbiology Dashboards:
• Monitor disease incidence and breakdown of confirmed cases across regions/provinces.• Top isolated organisms and resistance profiles.
Infectious diseases Programs:
• WHO GLASS compliance.• PMTCT program, CD4 & viral load tracking, suppressed levels.
• TB Programs.
Our Selected Clients
More than 2000+ Labs in 12 countries